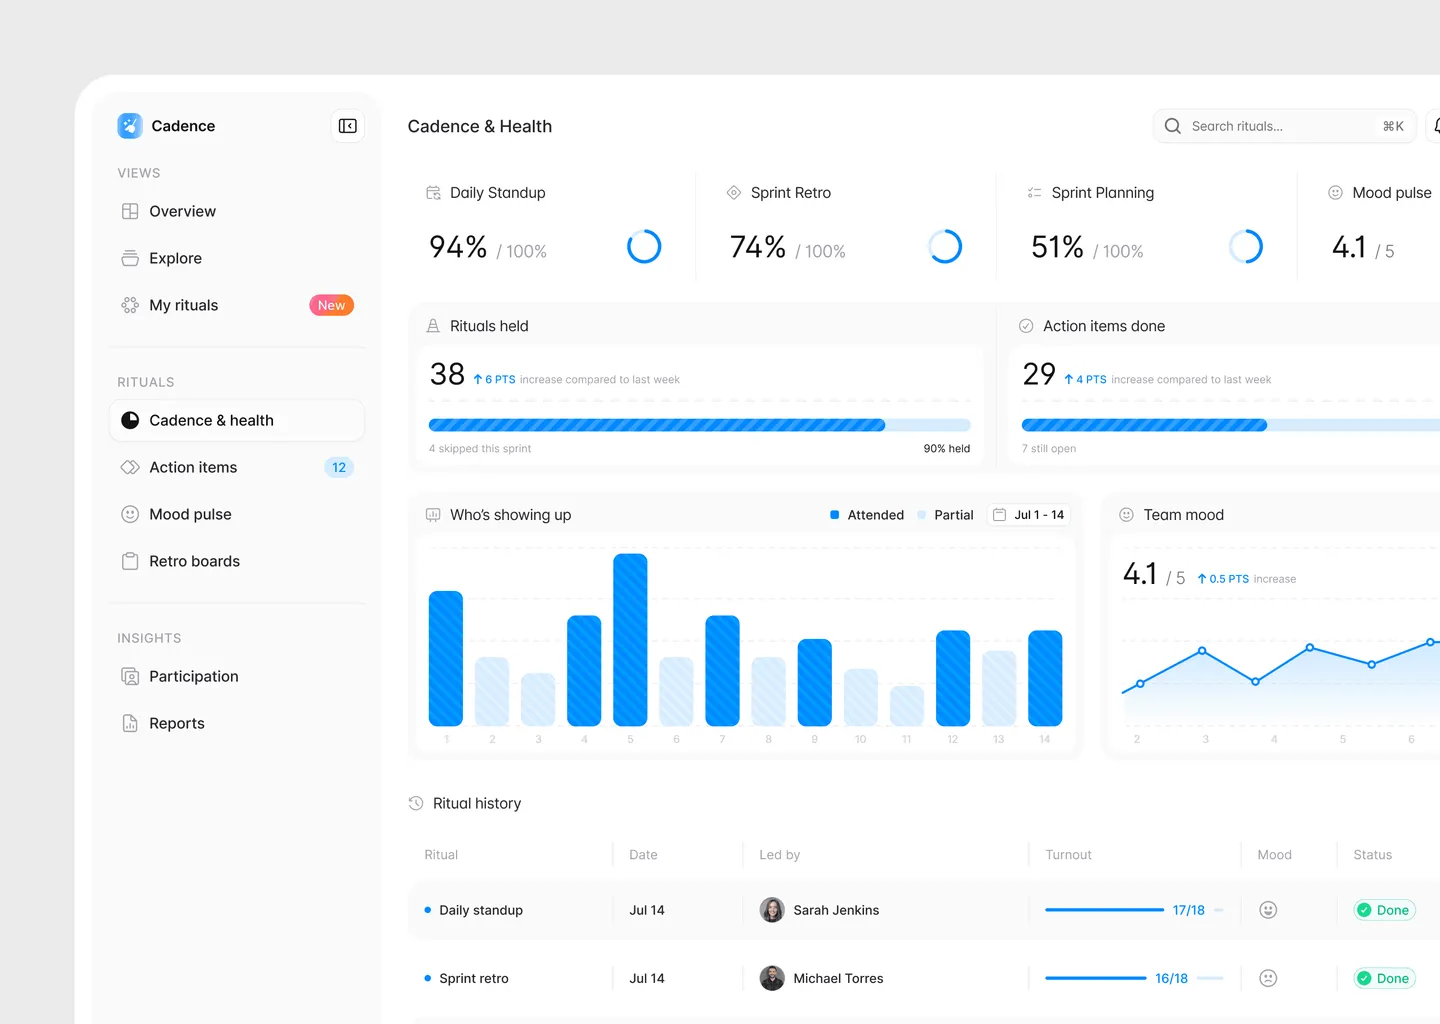
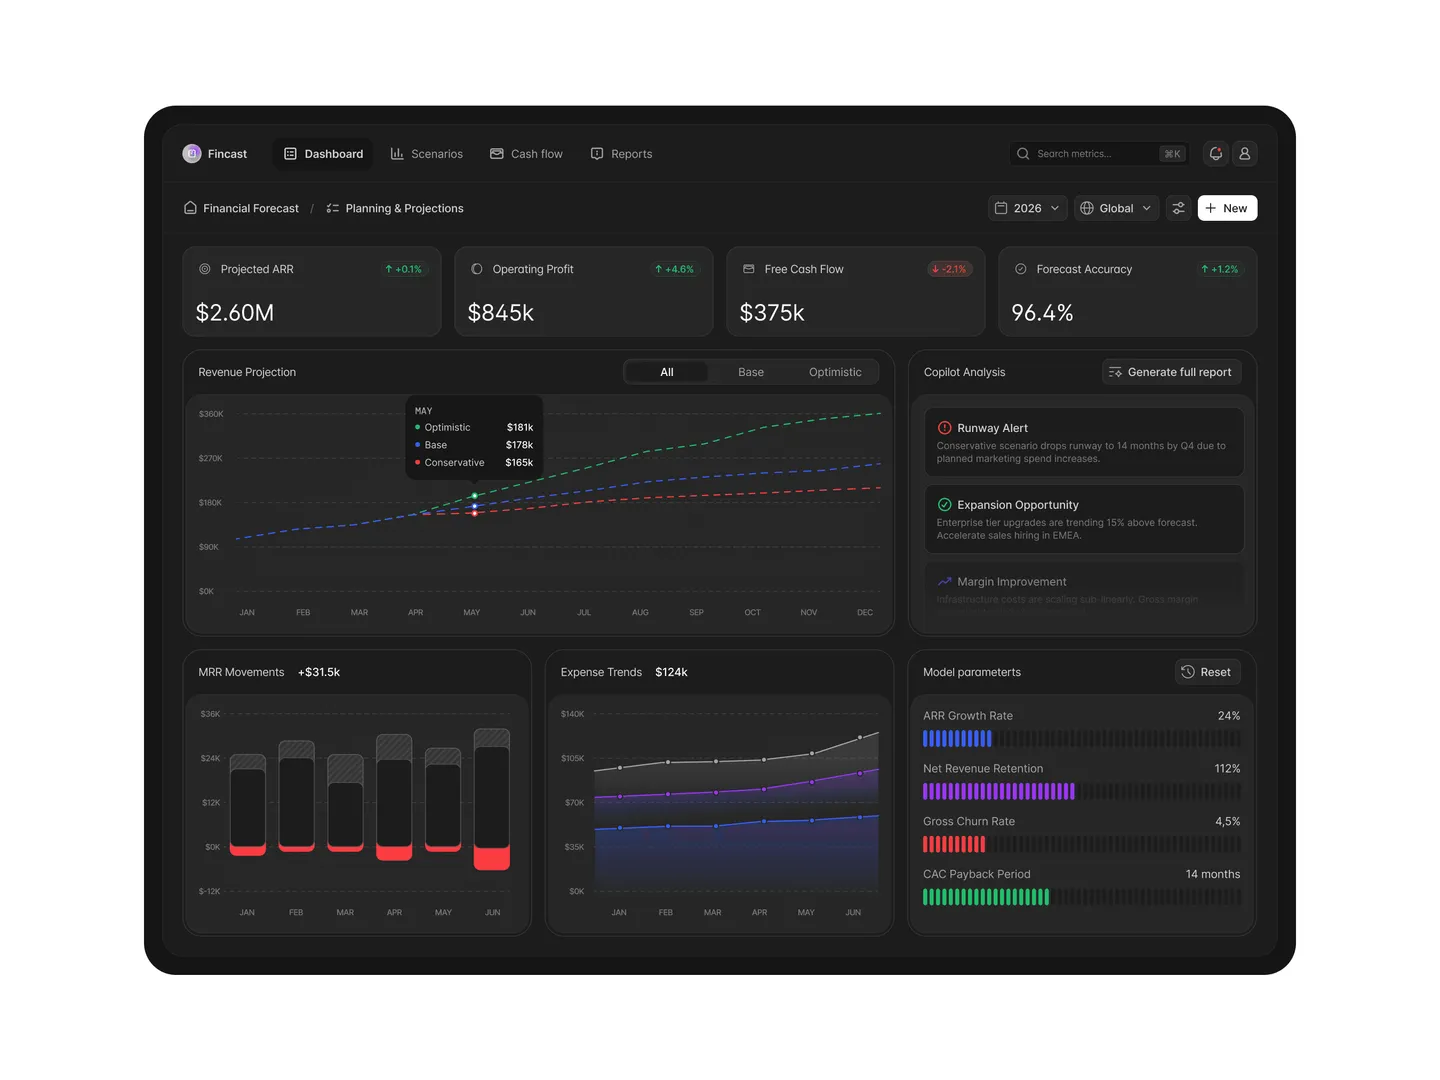
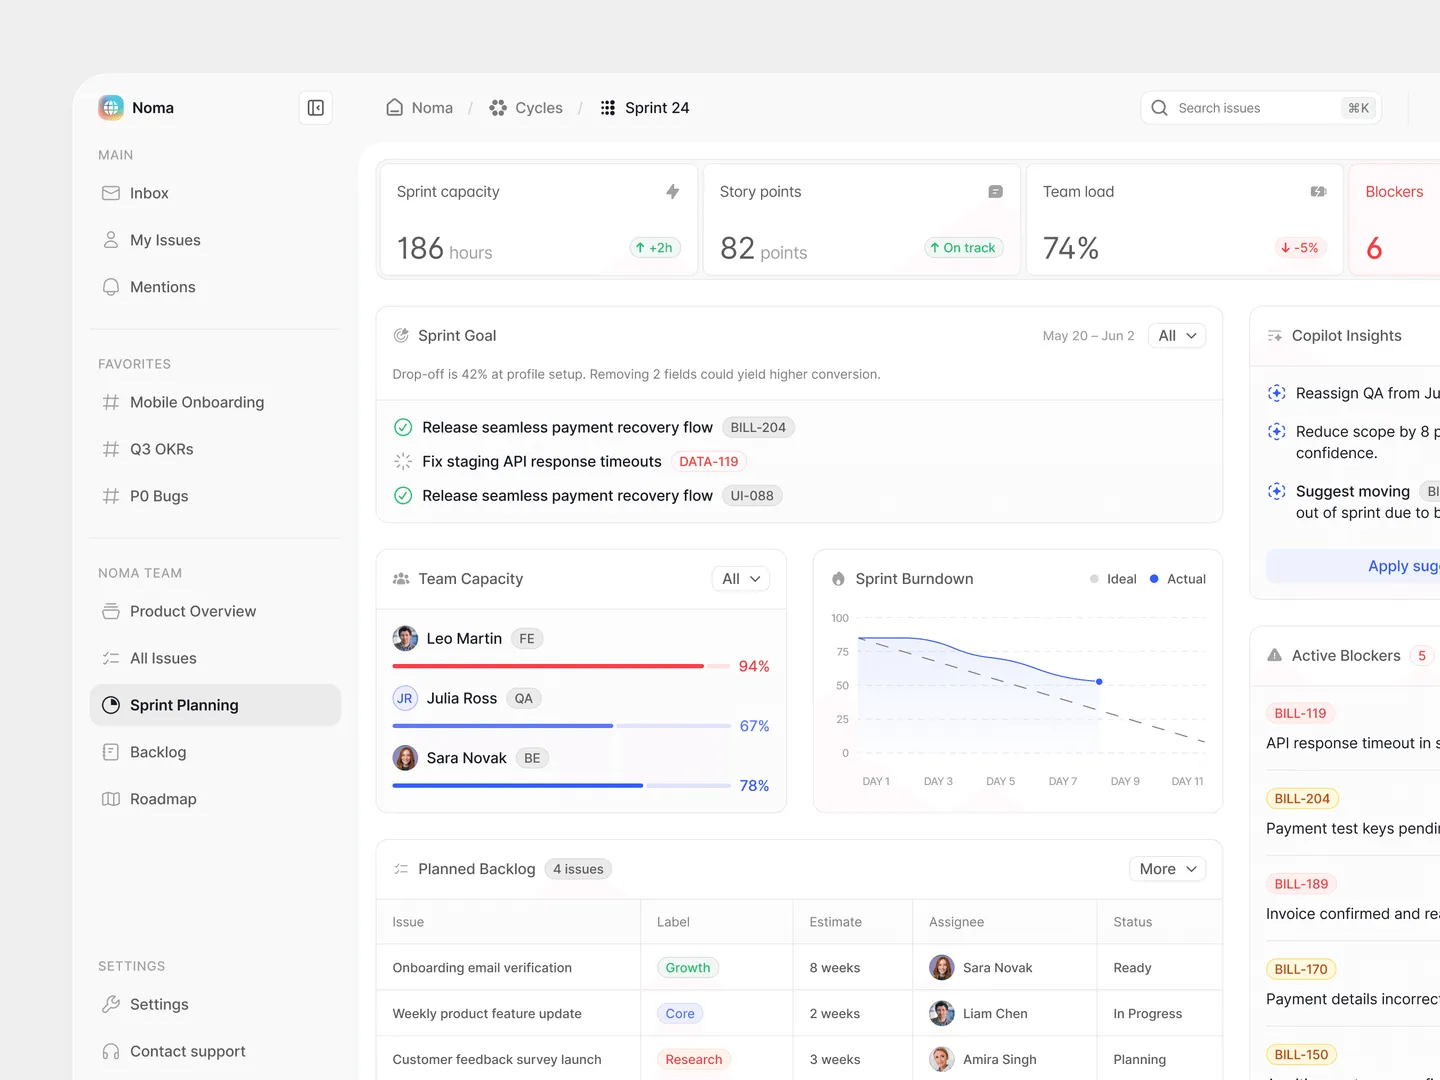
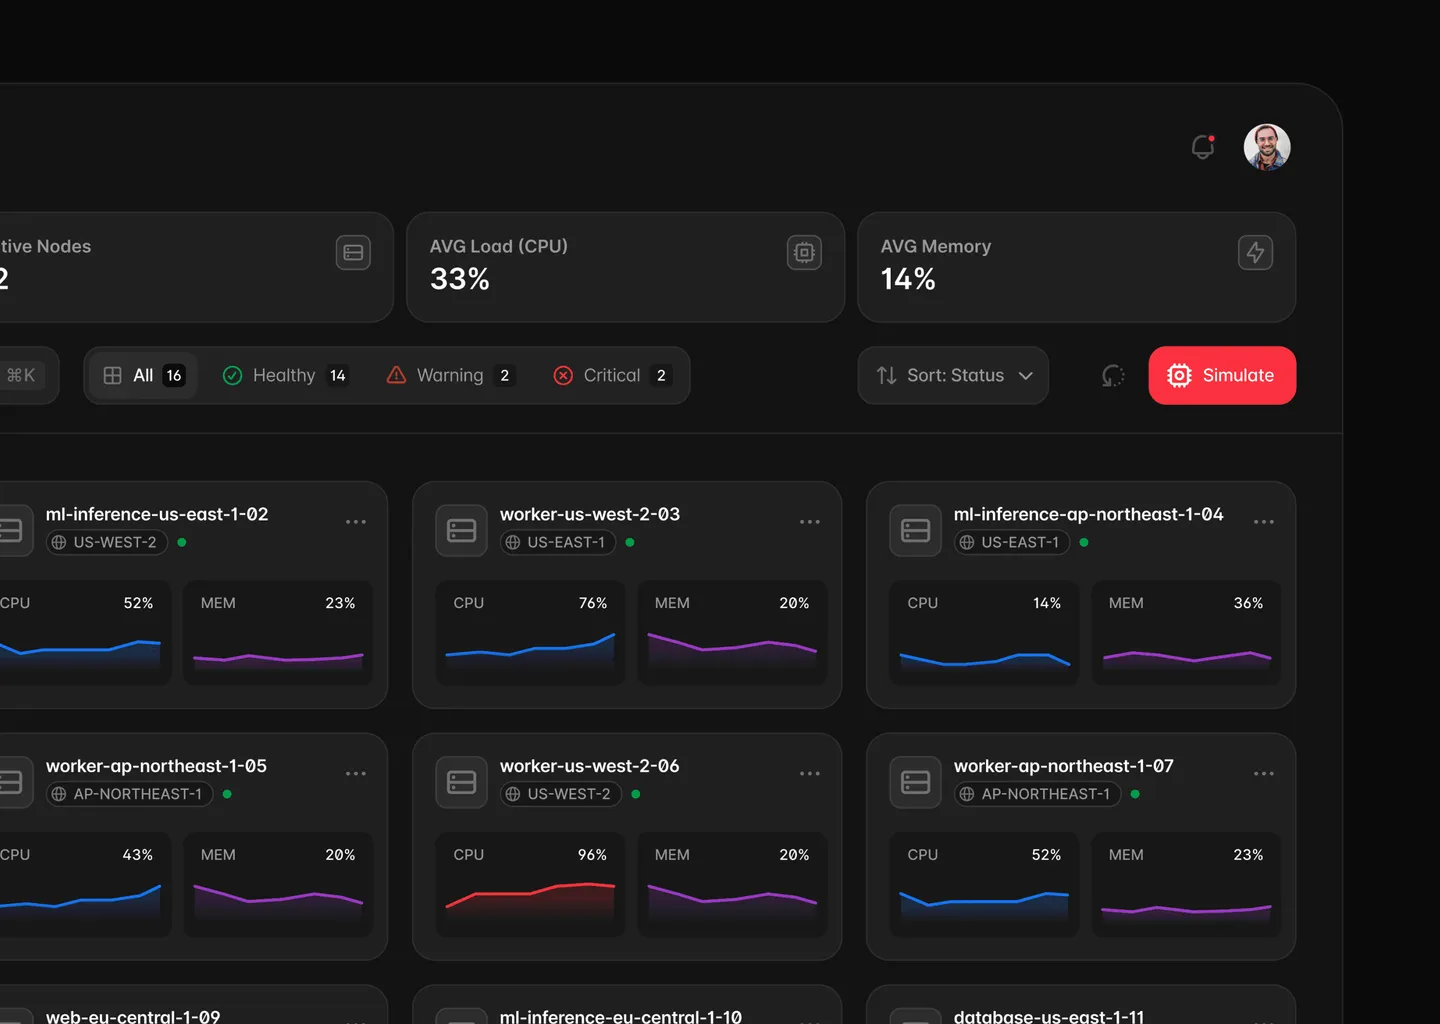
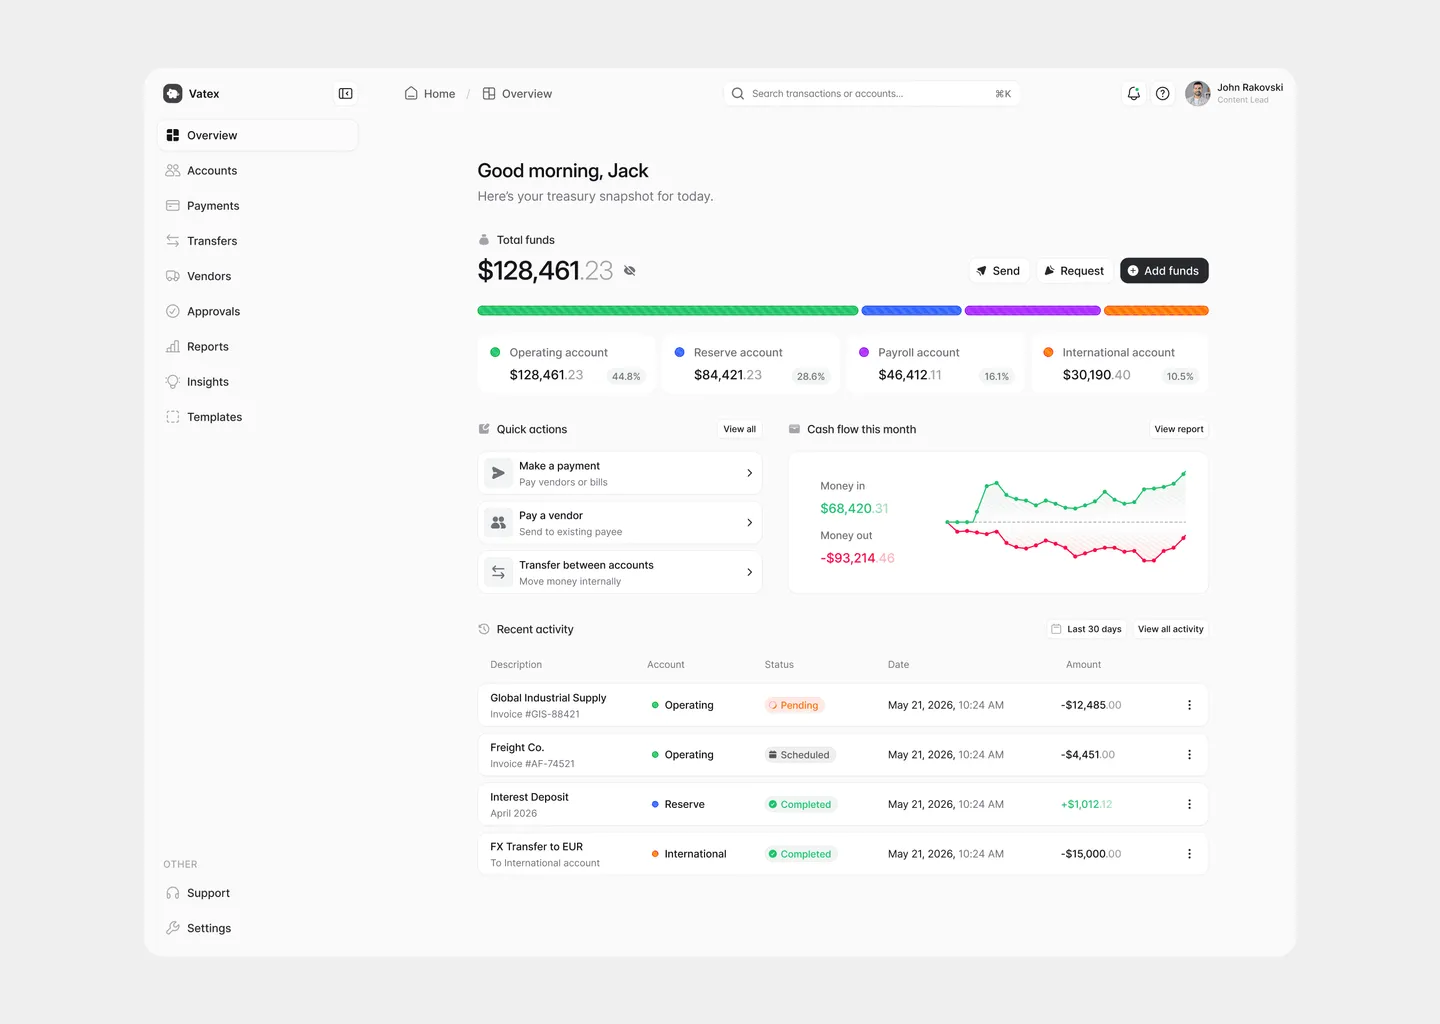
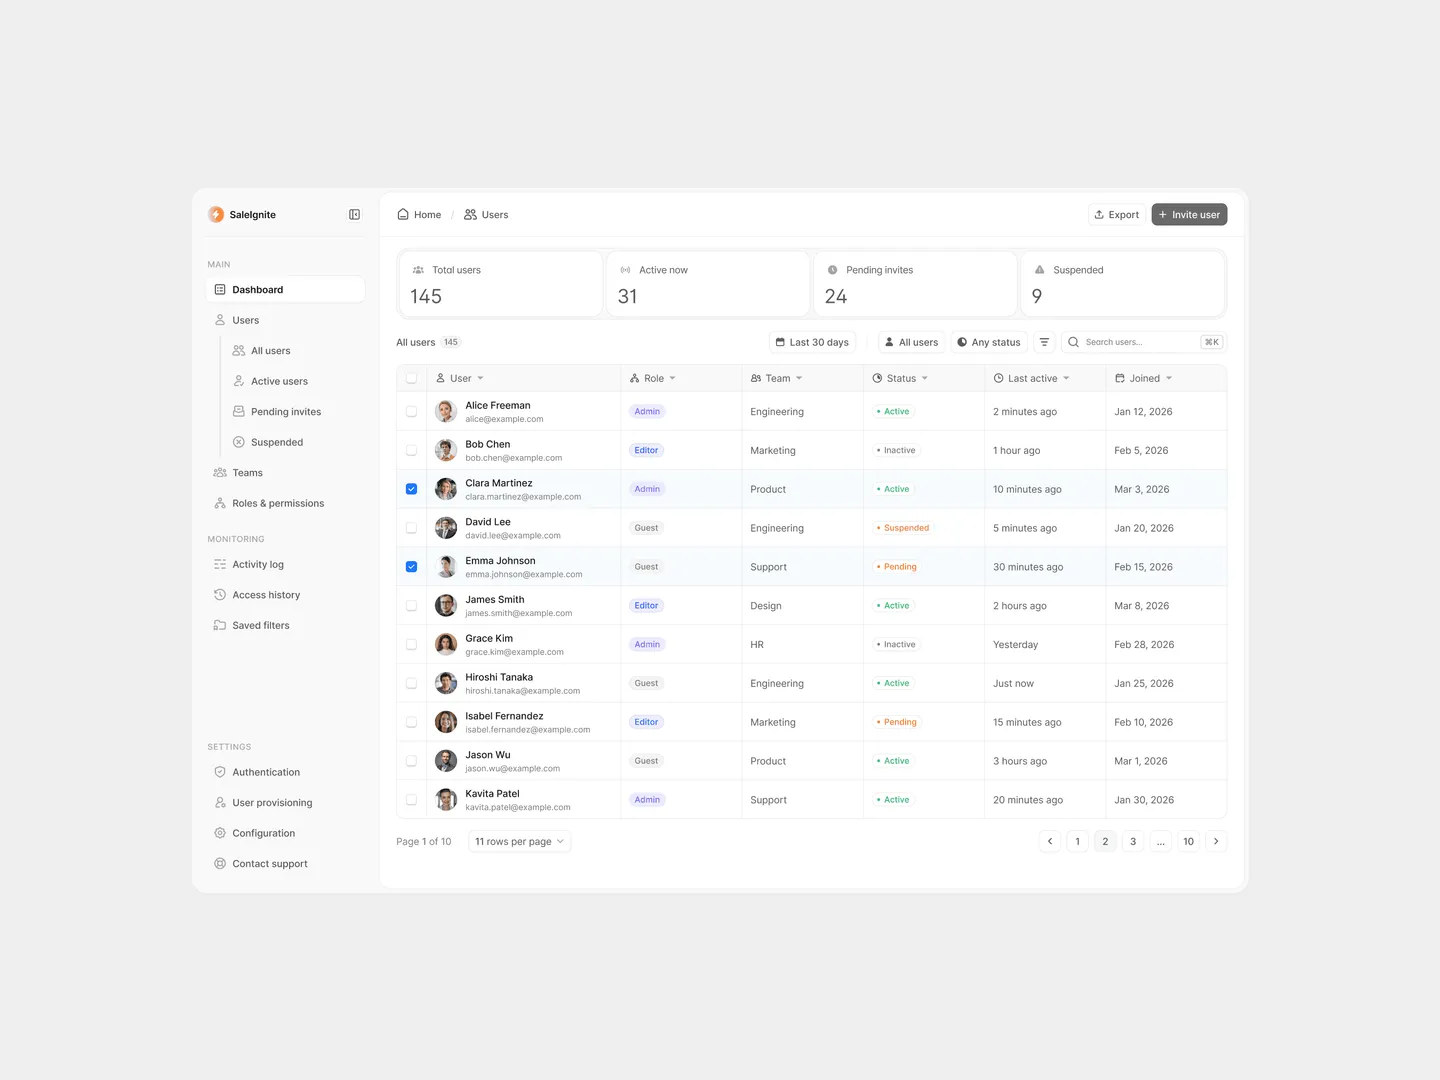
A dashboard is often the screen people see most in your product. If they can’t read it in a few seconds, they stop coming back, or they export the data and work it out in a spreadsheet.
Analytics and reporting
Numbers and charts that answer the question people opened the page for, before they have to scroll.
Key numbers
Charts
Reports
Admin and internal tools
Tables, filters and settings that let a team get through its work fast, without wrong clicks.
Tables
Roles and access
Bulk actions
AI and data products
Screens that show what the AI or the model did and why, so people trust the result and act on it.
Agencies win you with a senior pitch, then hand the work to someone you’ve never met. Here, that doesn’t happen. I’m Michael, and I do every project myself, from the first call to the final file.
It depends on how many screens and states the dashboard has, how complex the data is and how much is already built. Once we understand the scope, we’ll send you a clear quote.
Yes. Most dashboards we work on already exist. We keep what people use, fix what confuses them and make the whole thing calmer and easier to read, without starting from scratch.
Do you design with real data?
Yes, as early as we can. Real numbers show what breaks a layout, like long names, huge values or empty days, so we design for those cases too.
Can you work with the components our developers already use?
Yes. We design around the chart library and components your team already builds with, so the designs can be built the way they look.
Do you also design the rest of the product?
Yes. Dashboards are often one part of a bigger product. We design the whole thing, web and mobile, so it all feels the same.